CAD (Computer Aided Design)
Service
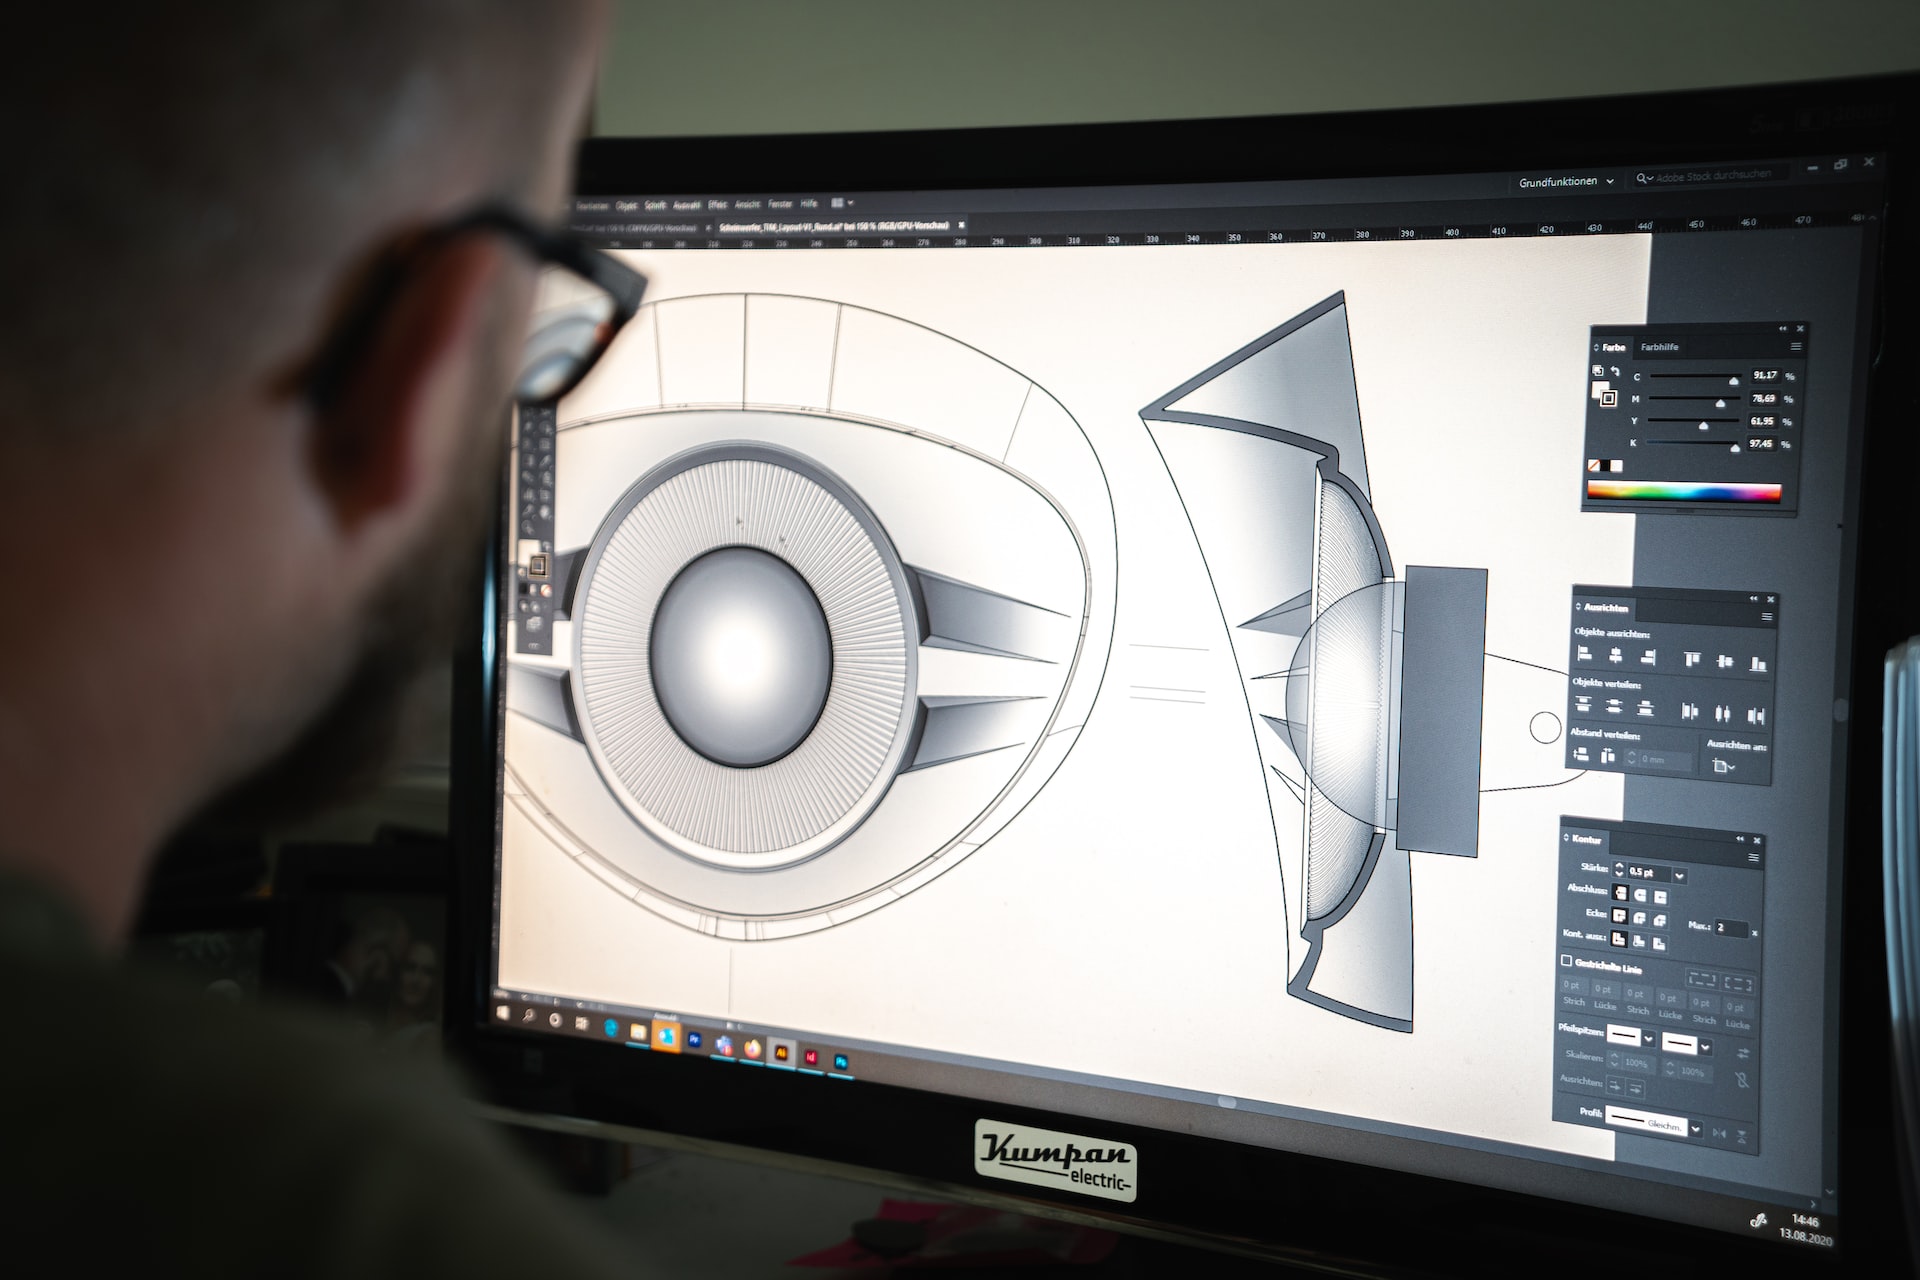
Computer-aided design is the use of computer systems to aid in the creation, modification, analysis, or optimization of a design. CAD software is used to increase the productivity of the designer, improve the quality of design, improve communications through documentation, and to create a database for manufacturing. CAD output is in the form of electronic files for print, machining, or other manufacturing
Operations
CAD, or computer-aided design and drafting (CADD), is the use of computer technology for design and design documentation. CAD software replaces manual drafting with an automated process. CAD software is used in many different types of engineering and design. The concept of designing geometric shapes for objects is very similar to CAD. It is called computer-aided geometric design (CAGD).
CAD is used as follows:
To produce detailed engineering designs through 3-D and 2-D drawings of the physical components of manufactured products. To create conceptual design, product layout, strength and dynamic analysis of assembly and the manufacturing processes themselves.

CAD, or computer-aided design and drafting (CADD), is the use of computer technology for design and design documentation. CAD software replaces manual drafting with an automated process.
Designs made from CAD software are used in a number of different industries, including architecture, engineering and manufacturing. CAD programs are typically used in conjunction with a plotter or a high-end large format printer. CAD software is used in many different types of engineering and design.
The concept of designing geometric shapes for objects is very similar to CAD. It is called computer-aided geometric design (CAGD).
CAD is used as follows:- To produce detailed engineering designs through 3-D and 2-D drawings of the physical components of manufactured products.
- To create conceptual design, product layout, strength and dynamic analysis of assembly and the manufacturing processes themselves.
- 3. To prepare environmental impact reports, in which computer-aided designs are used in photographs to produce a rendering of the appearance when the new structures are built.
AutoCAD is perfect for cleaning dwg files (vector data) and preparing them for import for GIS applications. Generally, it is used for preparing data for GIS. We can use it as a GIS application.
KNSOFT Designing Consultants providing CAD drafting services India -Hyderabad and for Global clients, we bring a deep understanding of CAD drafting to the table. Our ability to deliver on time with 100% accuracy has been the key to our success over the years.
GIS (Geographic information system)
Get the best GIS (Geographic information system) services from KNSOFT Design consultants. We provide GIS services across India and global. KNSOFT has done asset mapping, parcel mapping, property Tax mapping and road network mapping across India and specific for, Andhra Pradesh and Telangana states. Maps have been used for thousands of years, but it is only within the last few decades that the technology has existed to combine maps with computer graphics and databases to create geographic information systems or GIS.
Get the best GIS (Geographic information system) services from KNSOFT Design consultants. We provide GIS services across India and global. KNSOFT has done asset mapping, parcel mapping, property Tax mapping and road network mapping across India and specific for, Andhra Pradesh and Telangana states.
A Geographic Information System or Geographical Information System (GIS) is a system designed to capture, store, manipulate, analyze, manage, and present all types of spatial or geographical data.
Geographic Information Systems is a computer-based tool that analyzes stores, manipulates and visualizes geographic information, usually in a map. In other hand, we can say it is a system that collects, displays, manages and analyzes geographic information. The key word to this technology is Geography – this means that some portion of the data is spatial. In other words, data that is in some way referenced to locations on the earth.
Coupled with this data is usually tabular data known as attribute data. Attribute data can be generally defined as additional information about each of the spatial features. An example of this would be schools. The actual location of the schools is the spatial data. Additional data such as the school name, level of education taught, student capacity would make up the attribute data.
It is the partnership of these two data types that enables GIS to be such an effective problem solving tool through spatial analysis.
Geographic Information Systems really comes down to just 4 simple ideas
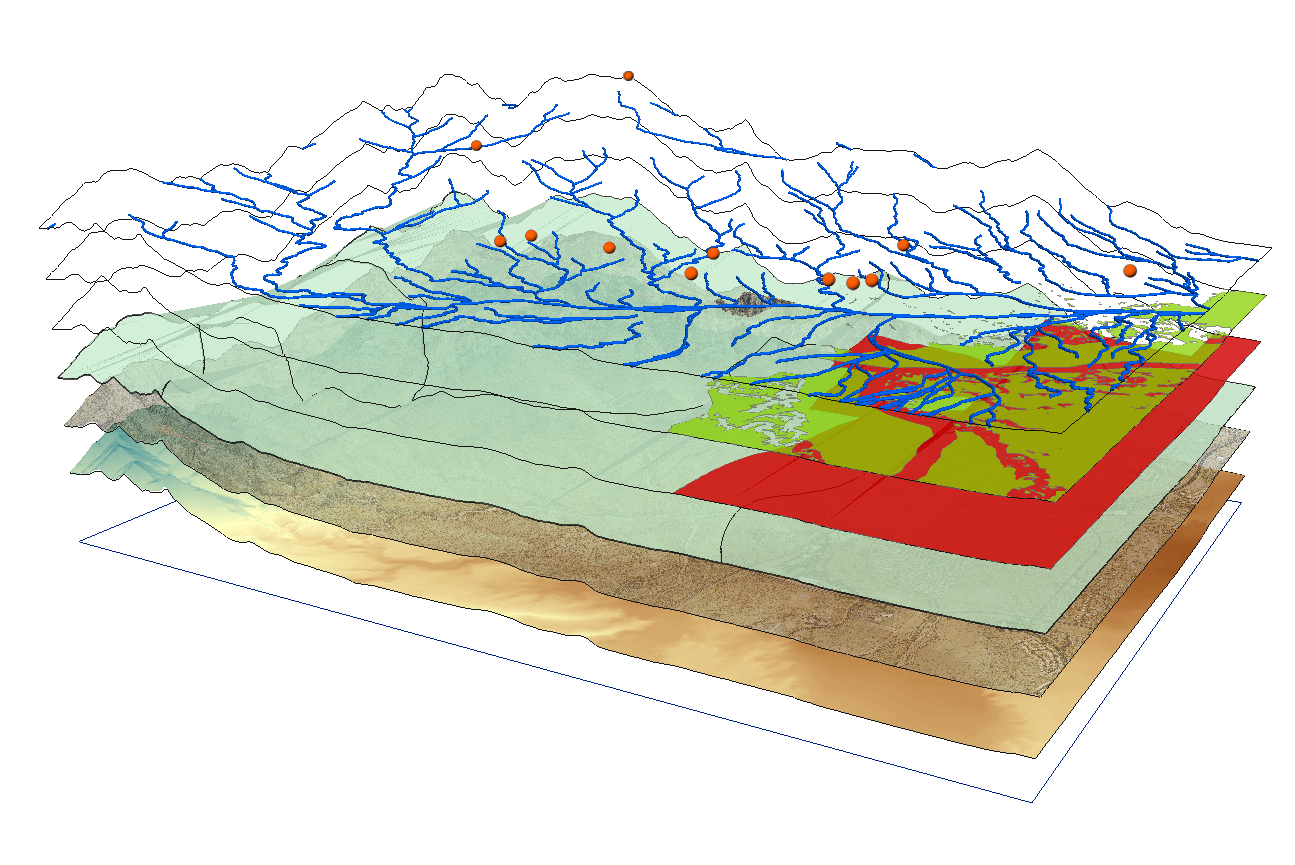
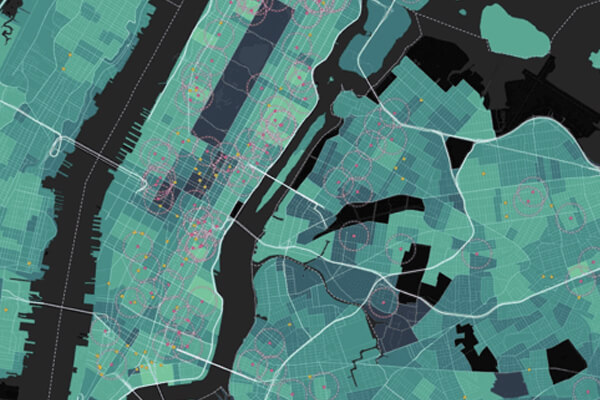
GIS mapping is the process of inputting data layers into GIS software to produce a map. Maps present users with legible information that raw data can’t display on its own. This is because humans absorb information better when looking at a visual representation of data rather than a numerical dataset; as a result, GIS mapping, which transforms data into maps is the most effective way to display geographical data.
GIS Tools for Urban Planning
- Database management
- Visualization
- Spatial analysis & modeling
- Field data collection
Practical Applications of GIS in Urban Planning
- Resource inventory
- Creating land-use maps & plans
- Planning applications
- Analyzing socioeconomic & environmental data
- Land suitability analysis/site selection
- Measuring connectivity
- Impact assessments
- Evaluation, monitoring, & feedback
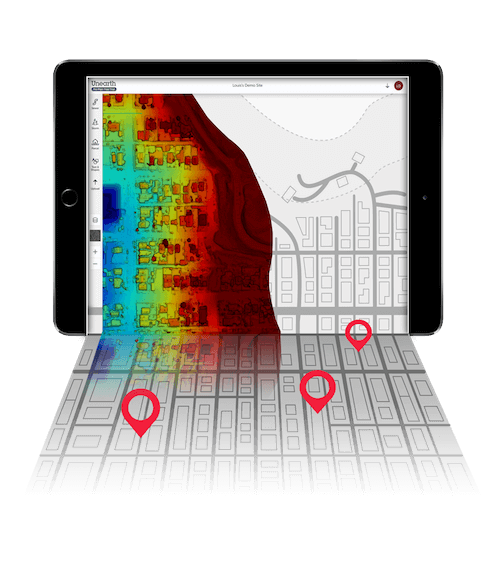
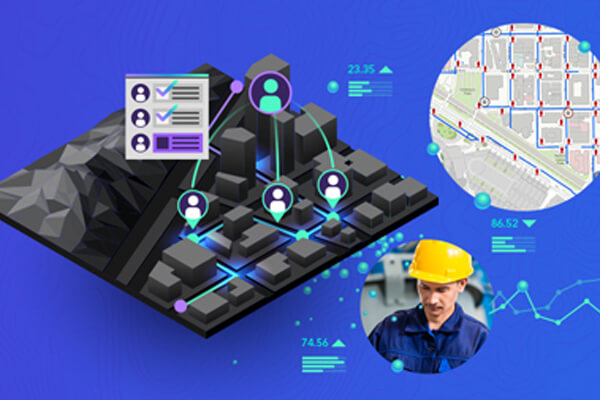
As almost every field of life, GIS can help in achieving excellence in transportation as well. It significantly aids in planning, monitoring and managing complex systems involved in transportation planning and management more effectively. GIS helps in determining capacity enhancements, improving operations, and identifying the most strategic investments for keeping the transportation system in any country running optimally. Let’s understand how we can use GIS in transportation for better management of road infrastructure. The use of GIS in transportation is widespread. The major areas of applications include highway maintenance, traffic modeling, accident analysis, and route planning.
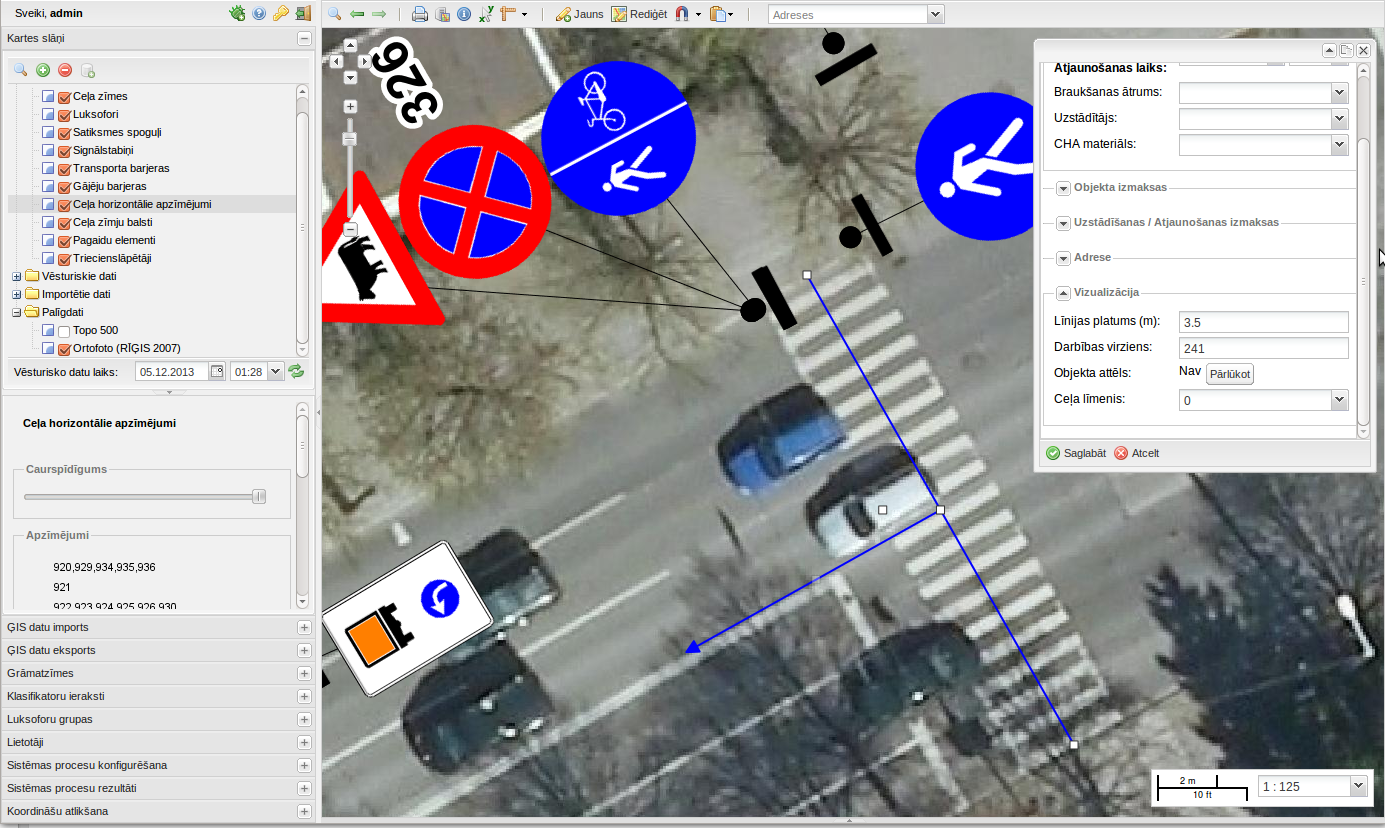
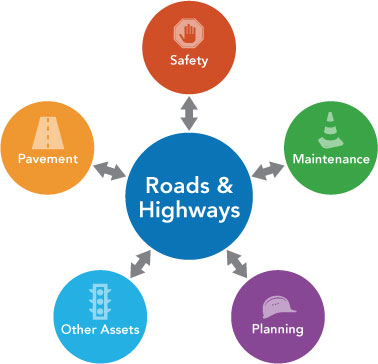
GIS in highway management
Highway maintenance management is a critical issue, which can be better harnessed using GIS. Authorities in many developed countries now actively use GIS for highways and transport management, mainly due to the benefits of falling costs and increasing ease. The most important objective of using GIS is visualization achieved through maps. With visualization of real-time data, transport planners can easily identify potential issues that can be addressed more efficiently and economically than with the prevailing methods. Through detailed GIS maps, this information can be easily conveyed to decision-makers and the public. For instance, Esri’s mobile GIS technology allows transportation maintenance and inspection crews to save time when collecting and updating information from remote locations. By using GPS and GIS-enabled devices, field crews accurately collect information from the field and seamlessly update corporate databases located in the office in real time. Through GPS and Esri technology, officials can track resources and assets in real time, allowing a quick response to any event that requires immediate attention. They can also more effectively manage mobile resources by instantly seeing the location of any work or inspection crew on a map, then redeploy resources as needed. Significant productivity gains are achievable by optimizing scheduling and routing maintenance and inspection teams, which not only boosts productivity but also results in significant fuel savings. The integration of work order management system, routing, and scheduling software allows modern highway managers to more efficiently direct their mobile workforces and ensure that resources are most effectively utilized.
Environmental Impact Analysis (EIA) is the assessment of the influence that a plan, policy or program might have or had on the environment while it was implemented. The purpose of this assessment is to help governments or non-governmental organizations to decide whether to proceed with the project or not. Simply put, it impacts the development of a sustainable economy. Over the past few decades, the idea of monitoring the impact human activities have on the environment has spread worldwide and has been recognized by decision-makers and the global community. GIS in environmental impact assessment is the main tool to visualize environmental impact information and put all the relevant data in a comprehensible presentation. Putting the robust information on map layers and analyzing it through GIS is especially beneficial since it saves big time on research that companies have to conduct. Additionally, it can help to comply with environmental legislation and other limitations.
EIA GIS data
Besides convenient data layering and analyzing hypothetical effects, GIS can also be an effective spatial tool for planning. For instance, with the help of GIS we can identify the perfect spots for exceptional objects like waste disposal factories or cemeteries. For this, specialists conduct screening (finding out whether the research is needed or not), scoping (identifying the main issues), prediction and mitigation (defining suggestions), management and monitoring, auditing, and public participation. Aspectum software can support these projects on any stage.
EIA mapping
Almost anything we, humans, do has its impact on the environment whether it’s going to be highways, factories, pipes, airports, or farms. Depending on the type of project, EIA comes in different forms and shapes. Usually, this impact can be calculated and featured in numbers. However, numbers are nowhere near as comprehensive as visuals. This is where maps come into place. With Aspectum mapping software you can clearly see where things are happening, to what extent, and how fast the picture changes.
-
Land Use Analysis:
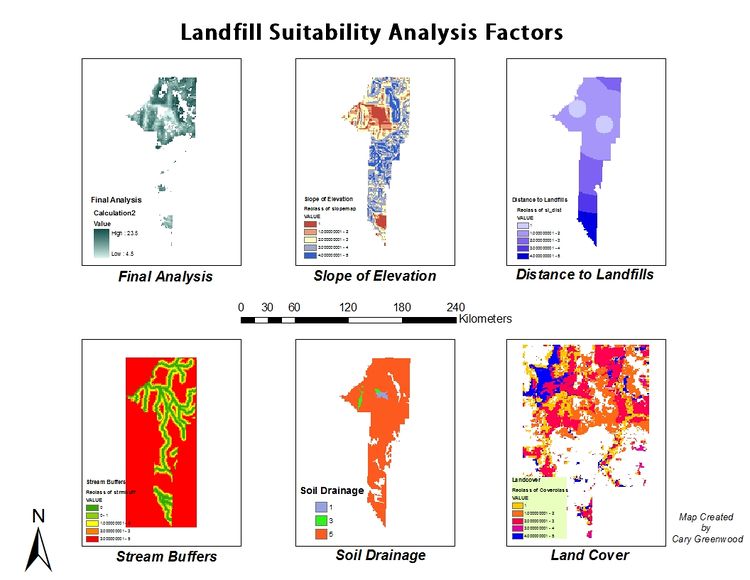
Most jurisdictions use land suitability analysis for site selection, impact studies, and land use planning. Generally the output of the analysis can be used to determine policy in regards to specific city ordinances and regulations. The goal with most suitability analysis done with land use is to find under-utilized and vacant land to further develop. The analysis provides information on the current land use of such sites as well as local utilities access and development patterns. Land use analysis helps cities learn where about areas they can afford to grow and areas that need redevelopment. -
Retail Site Selection:
Suitability analysis is critical for both marketing and merchandising purposes, as well as for choosing new retail locations. -
Agriculture:
Used extensively to find and maintain good cropland as well as ensure proper crop rotation. It is also used to determine areas of open range cattle areas and where areas need vegetation recovery. Suitability analysis of croplands helps to ensure that land resources are used in the most productive and sustainable ways. Different crops require different land types and growing conditions; for example, land that is suitable for growing corn may not be appropriate for growing rice or other crops. A suitability analysis of agricultural land using GIS is useful because it provides a way to look at many different layers of data for a given area. A GIS user can look at layers such as soil type, average rainfall, topography, and many others, and use this information to determine whether or not a given piece of land is well-suited for different agricultural practices. -
Defense:
Suitability analysis is used in defense in many different ways. It is essential in construction of bases and military outposts to find the most strategic location. It is used to find the safest route for convoys and transport ships. It can also find the most suitable areas of enemy strongholds and encampments. These analyses of military and defense applications rely heavily on Remote sensing. -
Crime Analysis:
Determines areas of crime rate based on spatial data. Can be used by law enforcement and city officials to locate areas of high crime and other problem areas. With this information city officials can focus on helping specific parts of their city and locate general targets for criminals. Additionally, it can be used by law enforcement to search for patterns in both type and quantity of crimes by utilizing the tools and methodology of Spatial Analysis.
More than just digitalizing, digitization is a process that includes digitizing and using data to ensure that they are more efficient and useful for the business. There are 3 basic methods of digitization available in GIS, that are:
Manual Digitizing
Manual digitizing is a process in which an image is copied manually by hand to create a digital file. A Puck is used to do manual digitizing which is similar to a mouse. It is done with the help of digitizing tablets and also has high accuracy when comparing to other digitizing methods
Heads-up Digitizing
Heads-up digitizing is a method of scanning paper documents into digital files. It helps to digitize paper documents without the risk of damage or loss of the original document.The process does have its limitations, including the inability to scan into colour or larger files. It also aids in making paperwork more organized and less time consuming due to troubleshooting time cut down significantly.
Automatic Digitizing
Automatic Digitizing is a process of converting raster to vector data or converting 2D or 3D objects into digital data. The primary purpose of automatic digitizing is to increase the speed and efficiency of GIS data collection. With this process, it is possible to collect, organize, and manage large volumes of data efficiently. The primary goal for automatic digitizers is to provide up-to-date spatial data in real-time.
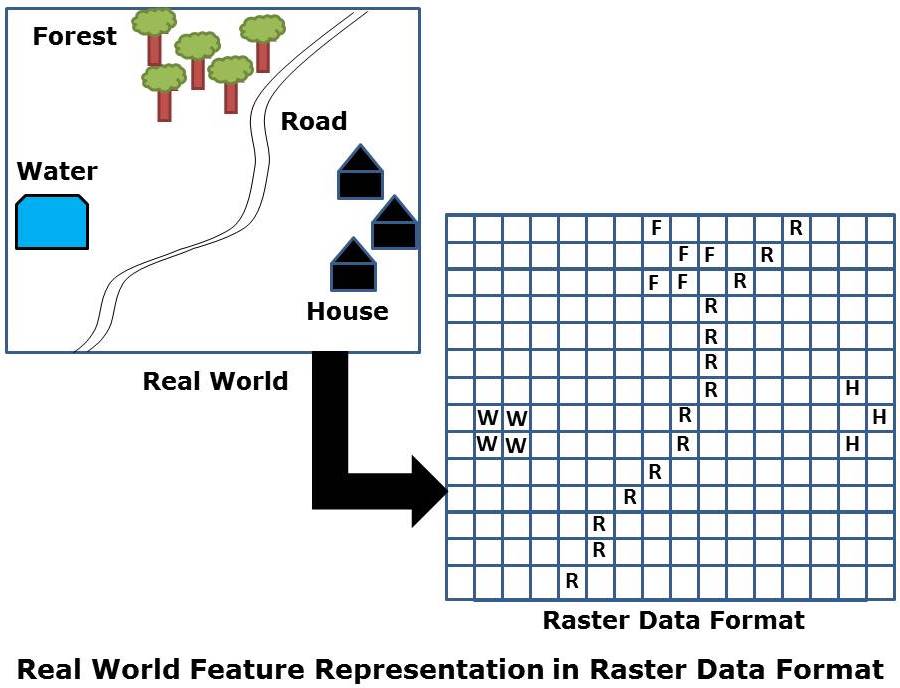
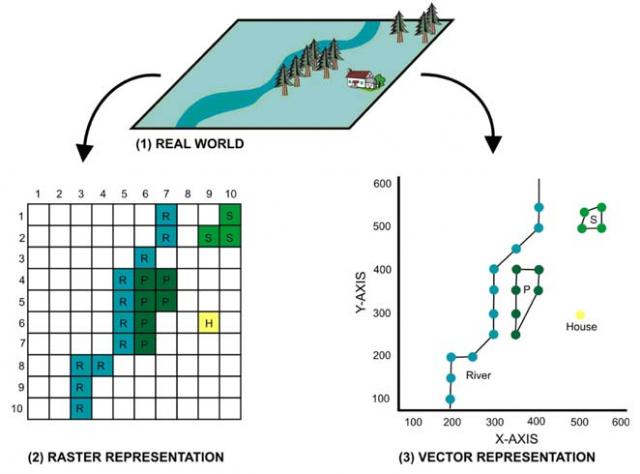
GIS stores information about the real world as thematic layers. Of course, these layers are all linked by their geographic coordinates. As a result, we save cost because of greater efficiency in record-keeping and can make powerful spatial analysis with ease. Geospatial data is created, shared, and stored in many different formats. The two primary data types are raster and vector. Vector data is represented as either points, lines, or polygons. Discrete (or thematic) data is best represented as vector. Data that has an exact location or hard boundaries are typically shown as vector data. Examples are county boundaries, the location of roads and railroads using lines, or point data indicating the location of fire hydrants.
Raster Formats
By contrast, raster data is best suited for continuous data, or information that does not have hard boundaries or locations. As Rasters, the data are viewed as a series of grid cells where each cell has a value representing the feature being observed. Think of raster data as appropriate for modeling surfaces like elevation, temperature, precipitation, or soil Ph. These phenomena are measured at intervals (think weather stations), and values in between are interpolated to create a continuous surface. Raster data also includes remote sensing imagery, like aerial photography and satellite imagery.
Vector Formats
SHP: Shape file
The ESRI Shape file has become an industry standard geospatial data format, and is compatible to some extent with practically all recently released GIS software. To have a complete shape file, we must have at least 3 files with the same prefix name and with the following extensions: .shp = shape file, .shx = header and .dbf = associated database file. Additionally, we may have a .prj = Projection file, a .lyr = layer file, and other index files. All these files must be saved in the same workspace.
GDB: Geo database
The file geo database is a collection of geographic datasets of various types, with the most basic types being vector, raster, and tabular data. There are three types of geo databases: file, personal, and ArcSDE. Geo databases are the native data format for ESRI’s ArcGIS.
Remote Sensing Services
Remote Sensing is a closely aligned technology to Photogrammetry in that it also collects information from imagery. The term is derived from the fact that information about objects and features is collected without coming into contact with them. Where remote sensing differs from Photo-grammetry is in the type of information collected, which tends to be based on differences in color, so land use and land cover is one of the primary outputs of remote sensing processing. Remote sensing was originally conceptualized to exploit the large number of color bands in satellite imagery to create 2D data primarily for GIS. Nowadays remote sensing tools are used with all types of imagery to assist in 2D data collection and derivation, such as slope. Software tools today tend to hold a much wider range of image technologies such as image mosaicing, 3D visualization, GIS, radar as well as softcopy Photogrammetry.
Key concepts: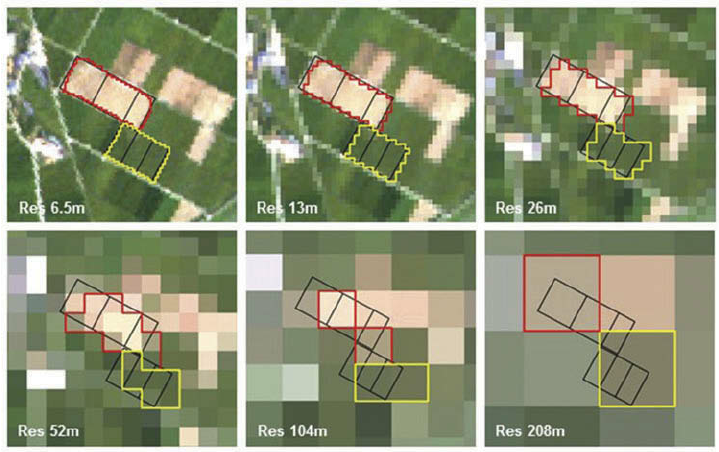
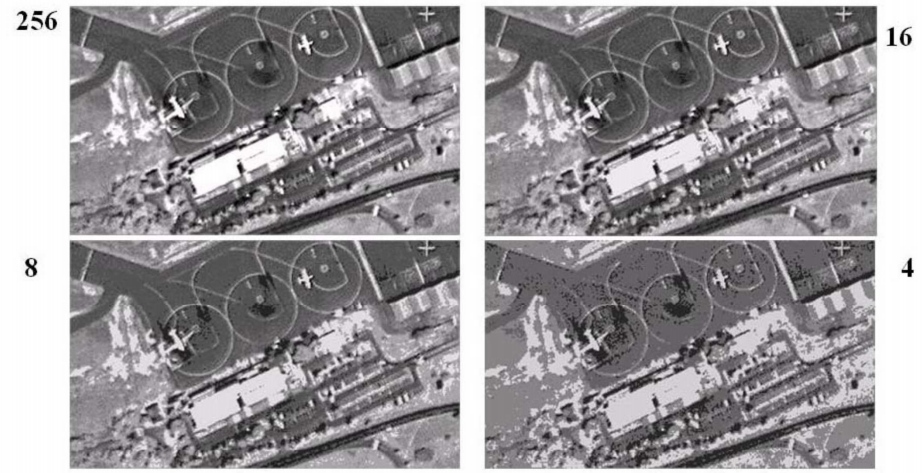
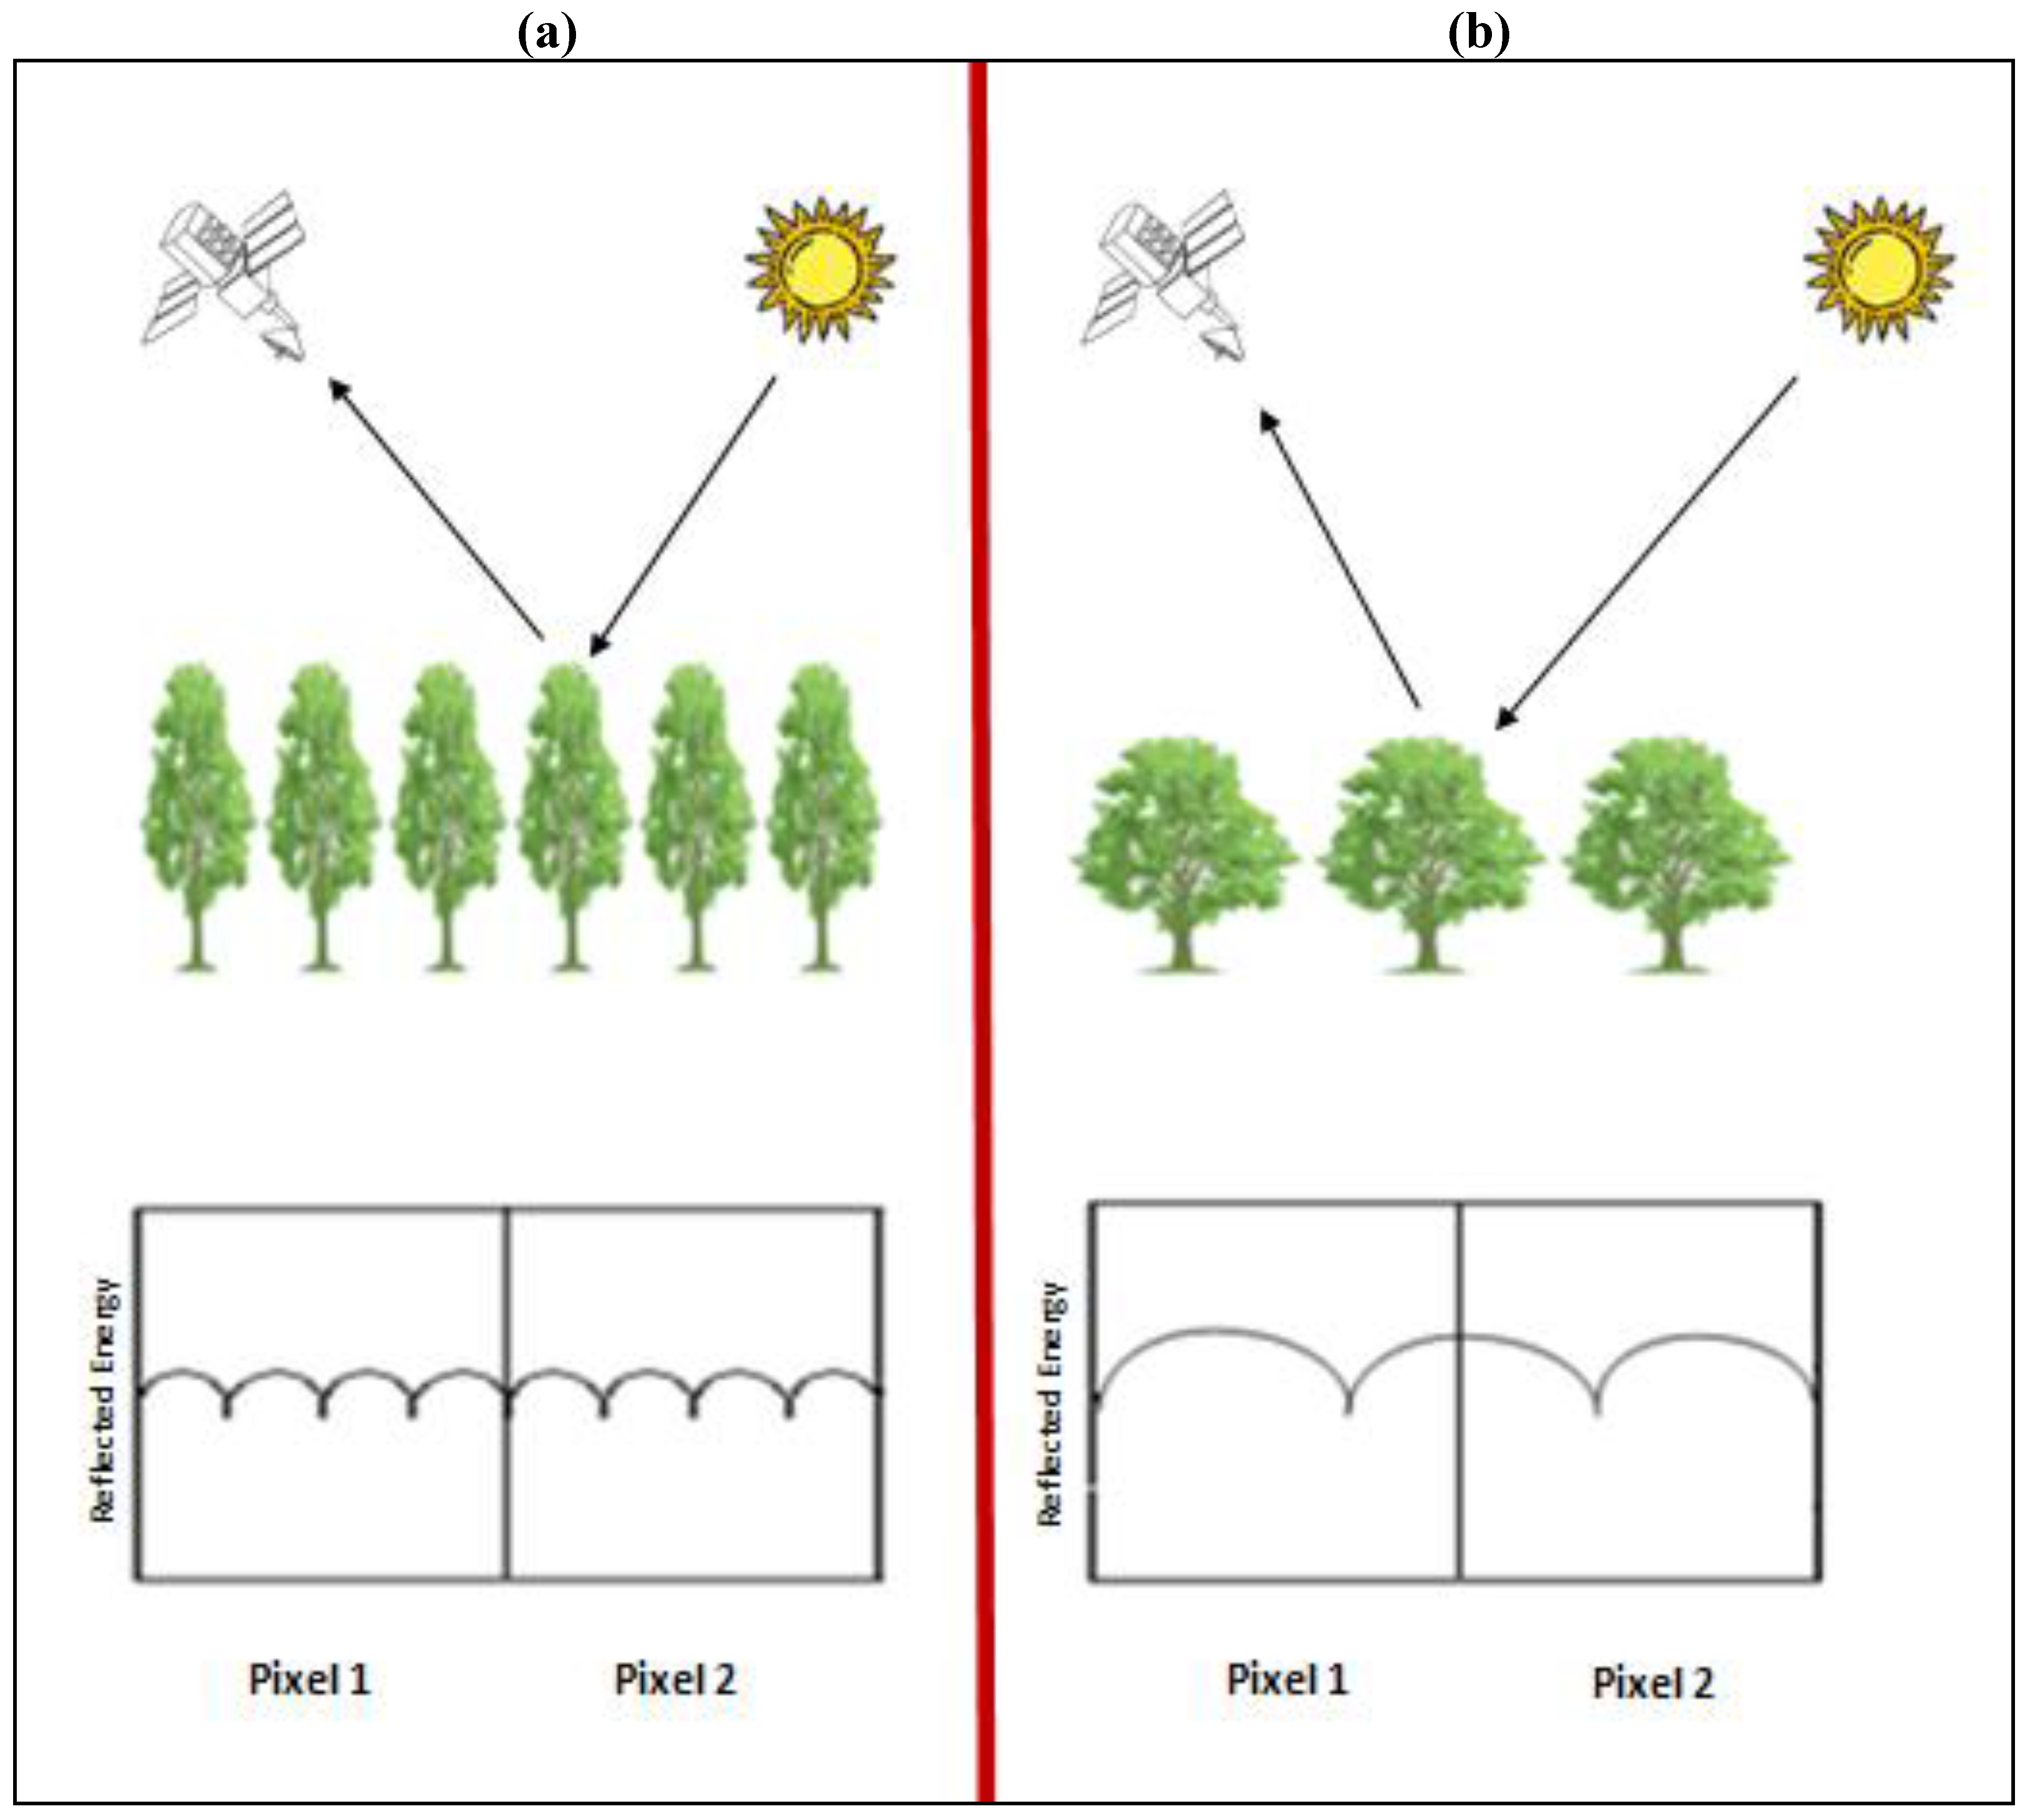
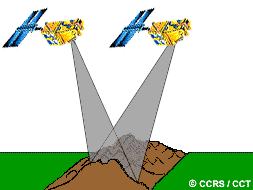

Photo-grammetry Services
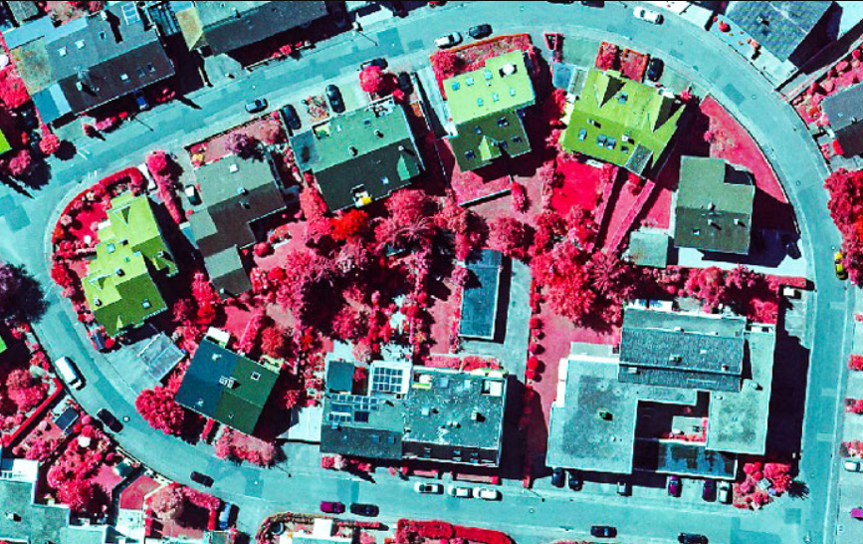
Get the best Photo-grammetry services in Hyderabad, India from KNSOFT design consultants. We offer a wide variety of photogrammetric services such as Aerial, Terrestrial, and Close-range Photo-grammetry. Photo-grammetry is the art, science, and technology of obtaining information about physical objects and the environment by photographic and electromagnetic images.
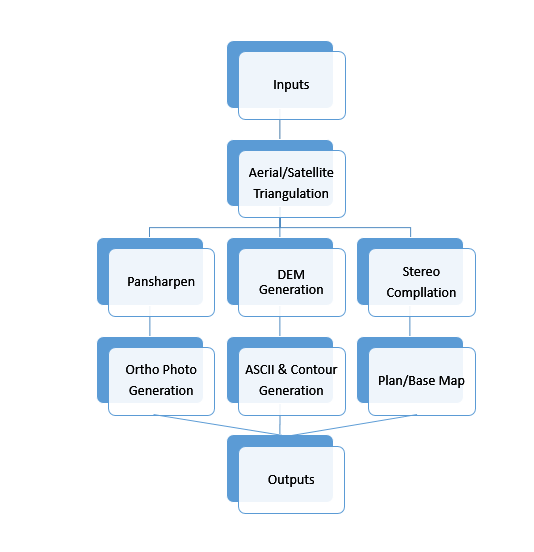
Photo-grammetry uses methods from many disciplines, including optics and projective geometry. Digital image capturing and photogrammetric processing includes several well-defined stages, which allow to generation 2D or 3D digital models of the object as an end product. The data model on the right shows what type of information can go into and come out of photogrammetric methods.
LiDAR (Airborne/Mobile/Terrestrial)
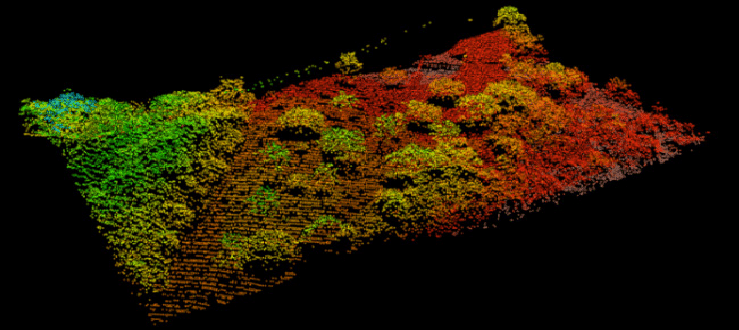
LiDAR, which stands for Light Detection and Ranging, is a remote sensing technology that measures ranges (variable distances) to the Earth by using light in the form of a pulsed laser. These light pulses—combined with other data recorded by the airborne, terrestrial, or underwater system— generate precise, three-dimensional information about the shape of the Earth and its surface characteristics.
The point data is post-processed after the LiDAR data collection survey into highly accurate geo-referenced x, y &z coordinates by analyzing the laser time range, laser scan angle, GPS position, and INS information. Laser pulses emitted from a LiDAR system reflect from objects both on and above the ground surface: vegetation, buildings, bridges, and so on.
- Raw LiDAR data
- Classified point cloud
- DTM (grid or model key points)
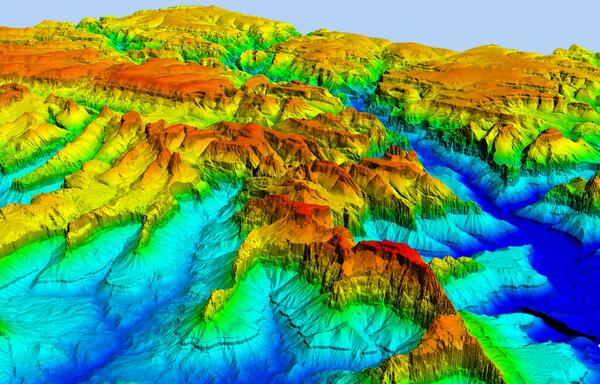
- DSM (Digital surface model)
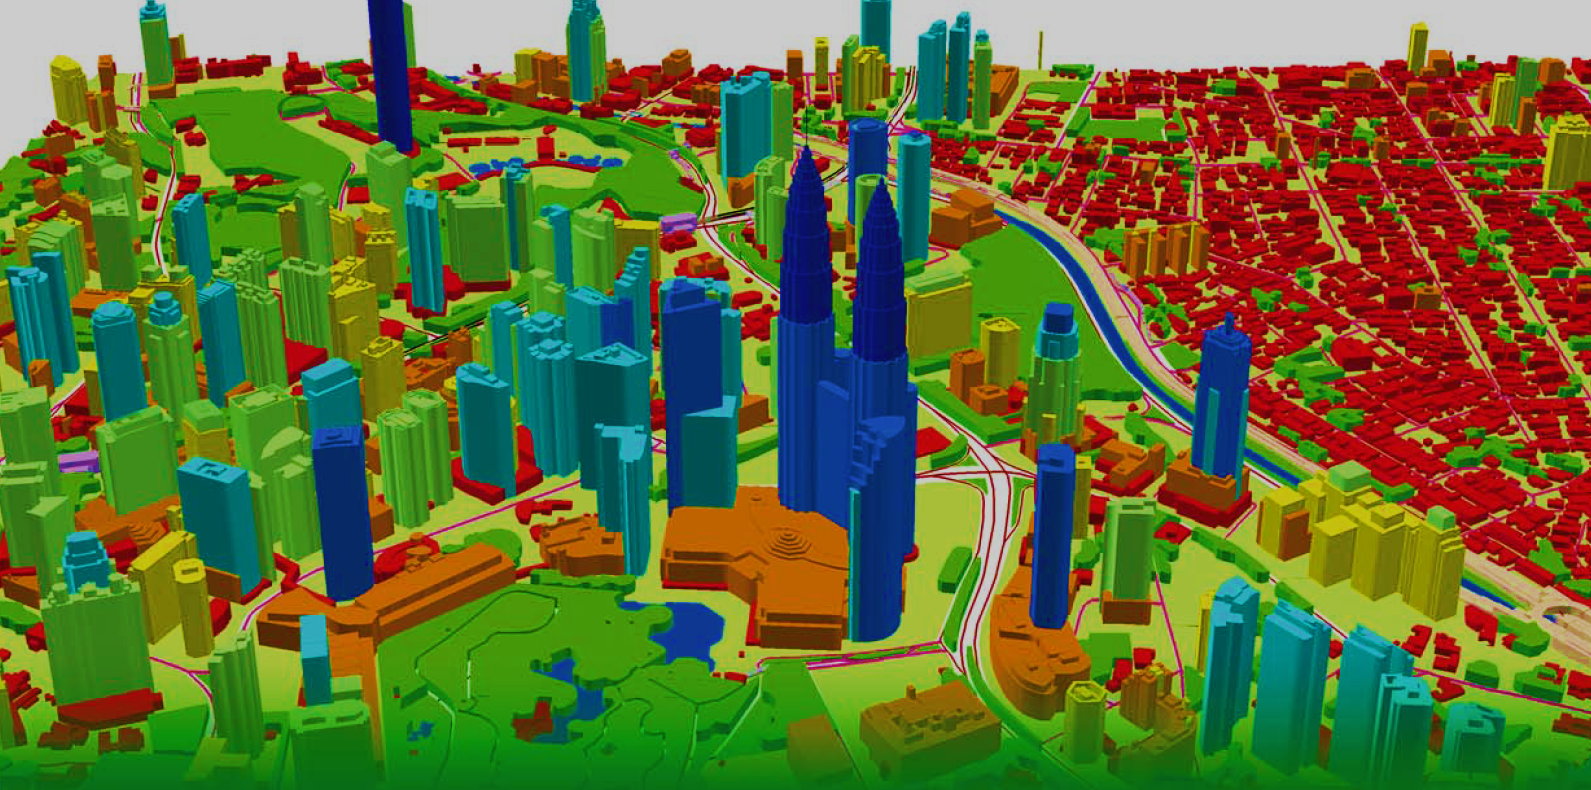
- DHM (Digital House Model)
- DEM (Digital Elevation Model)
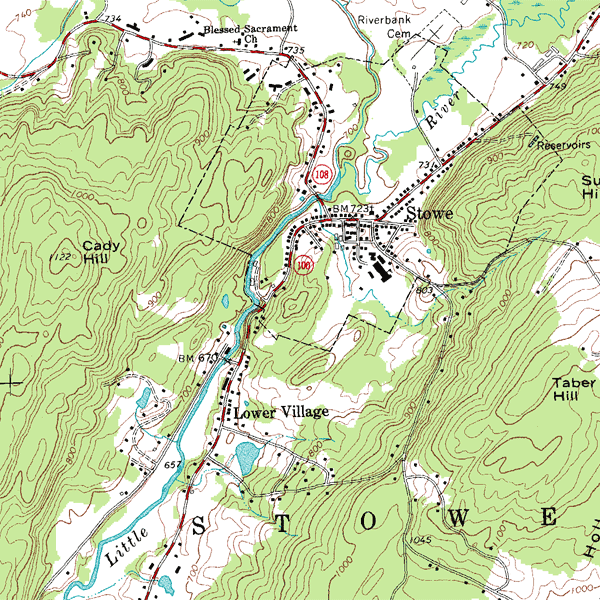
- Contour line maps
- Ortho photos / Ortho mosaic
- Vectorized maps
- Volume calculation
- 3D models
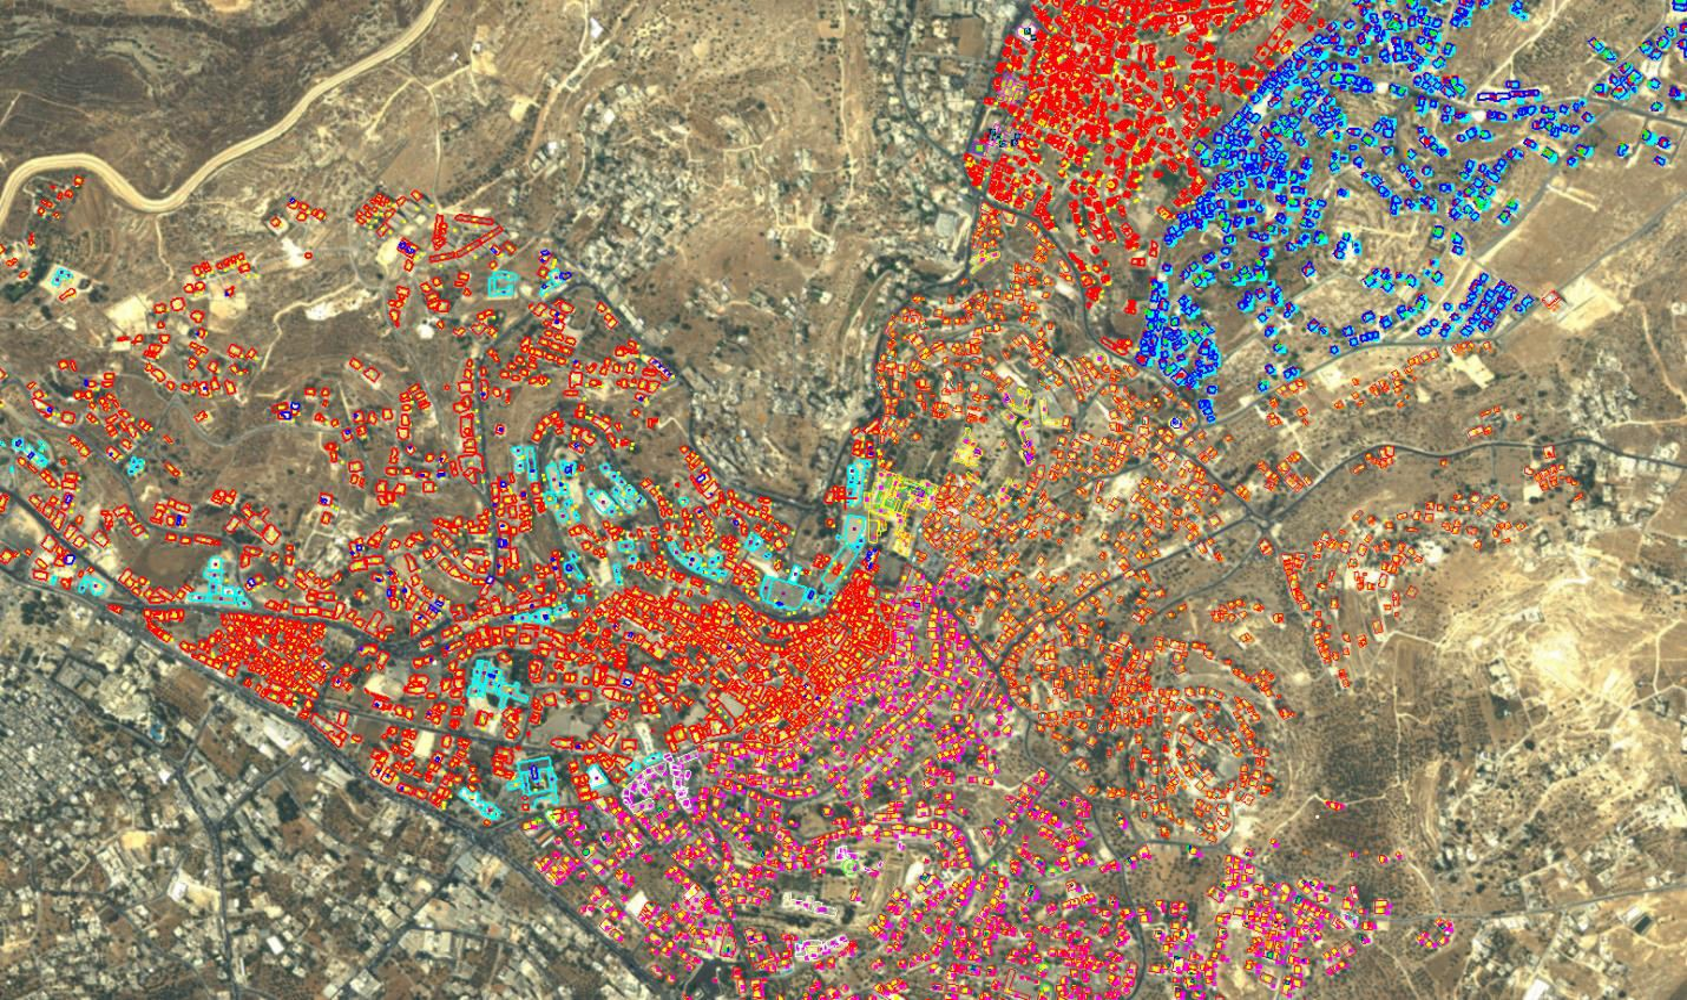
LiDAR DATA PRODUCTS
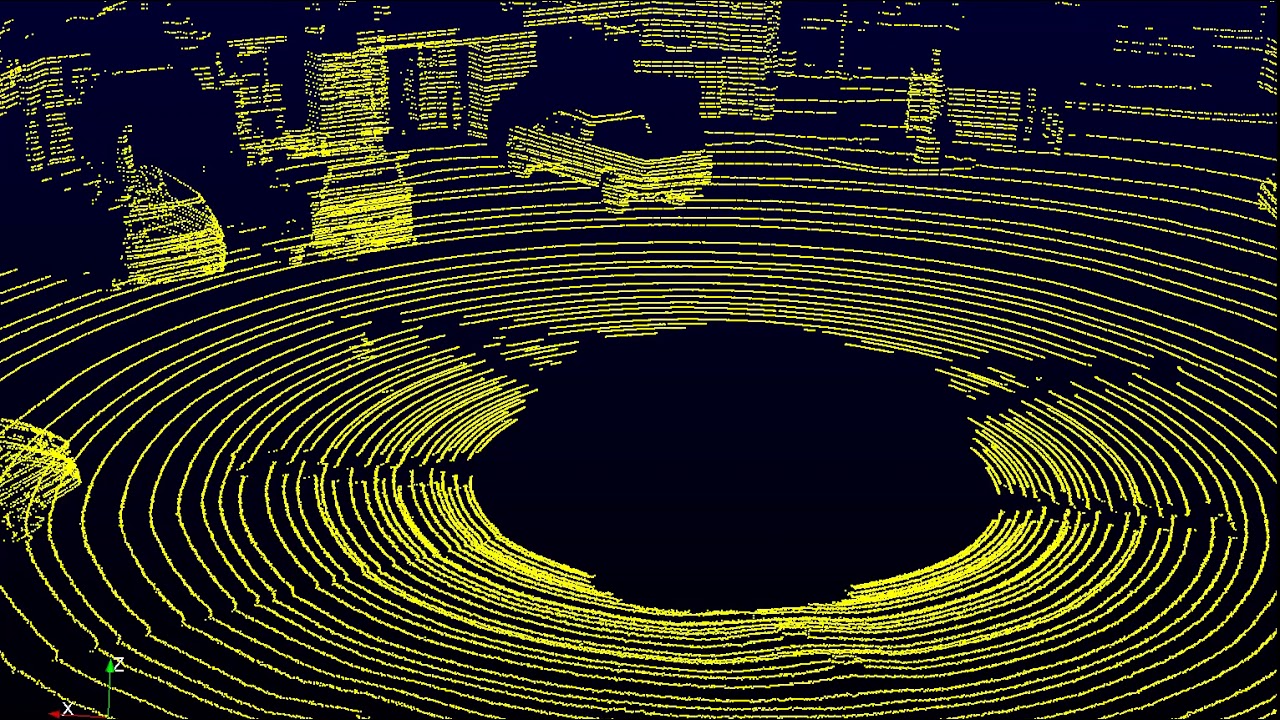
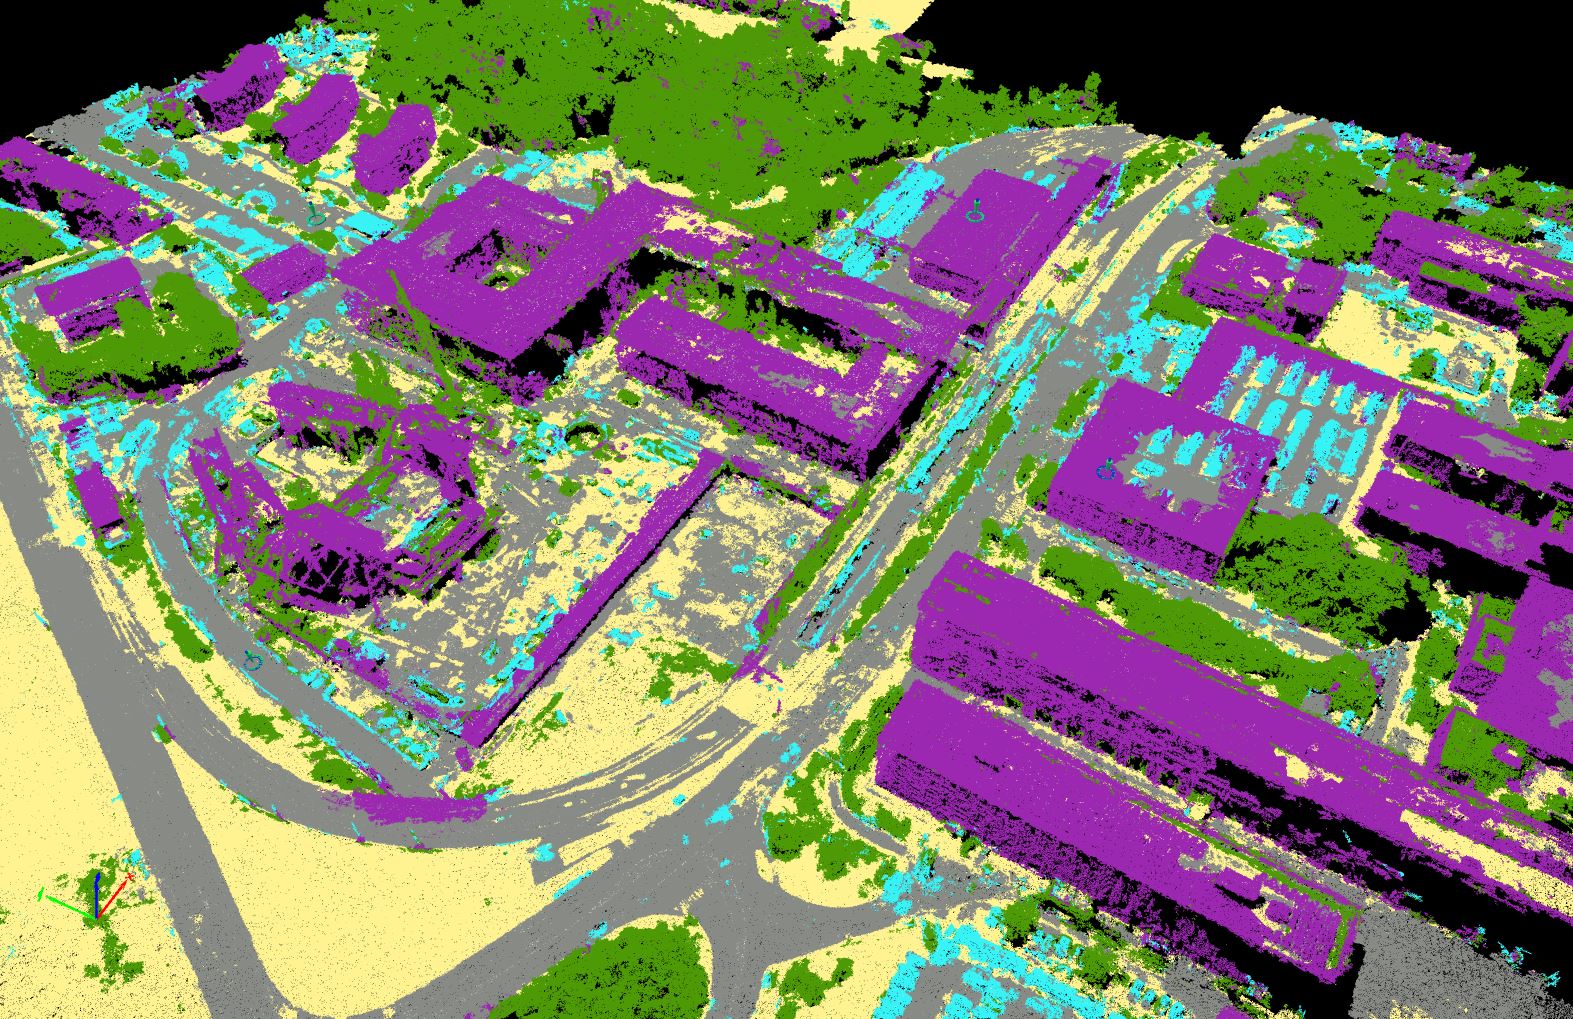
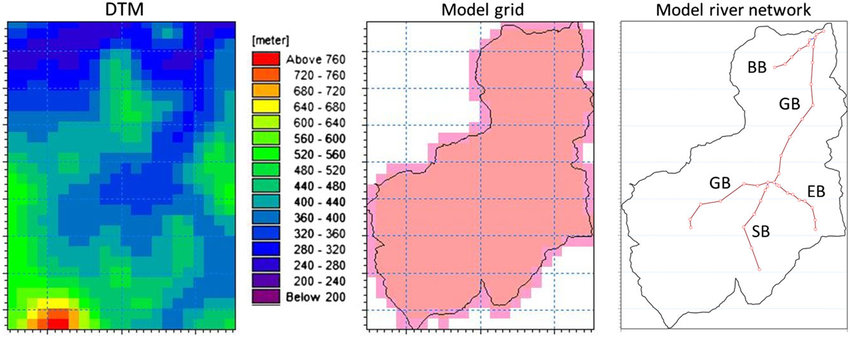
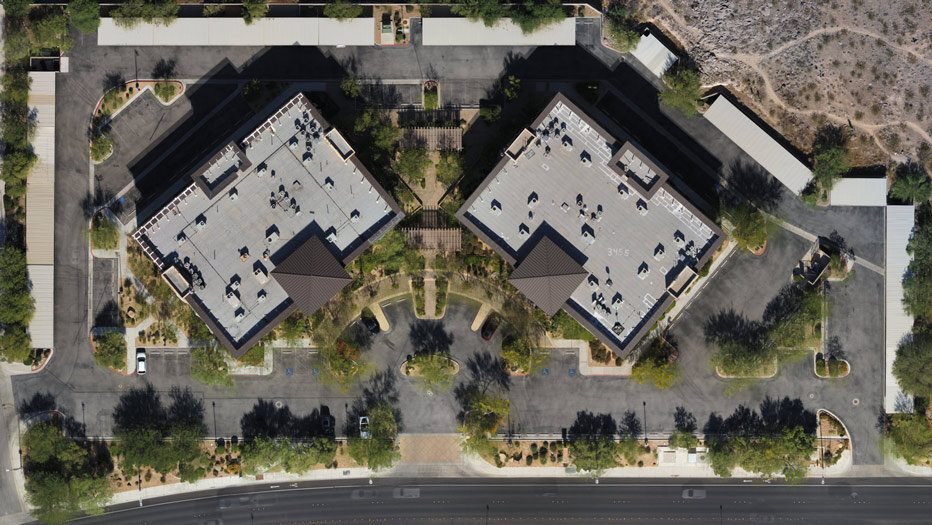
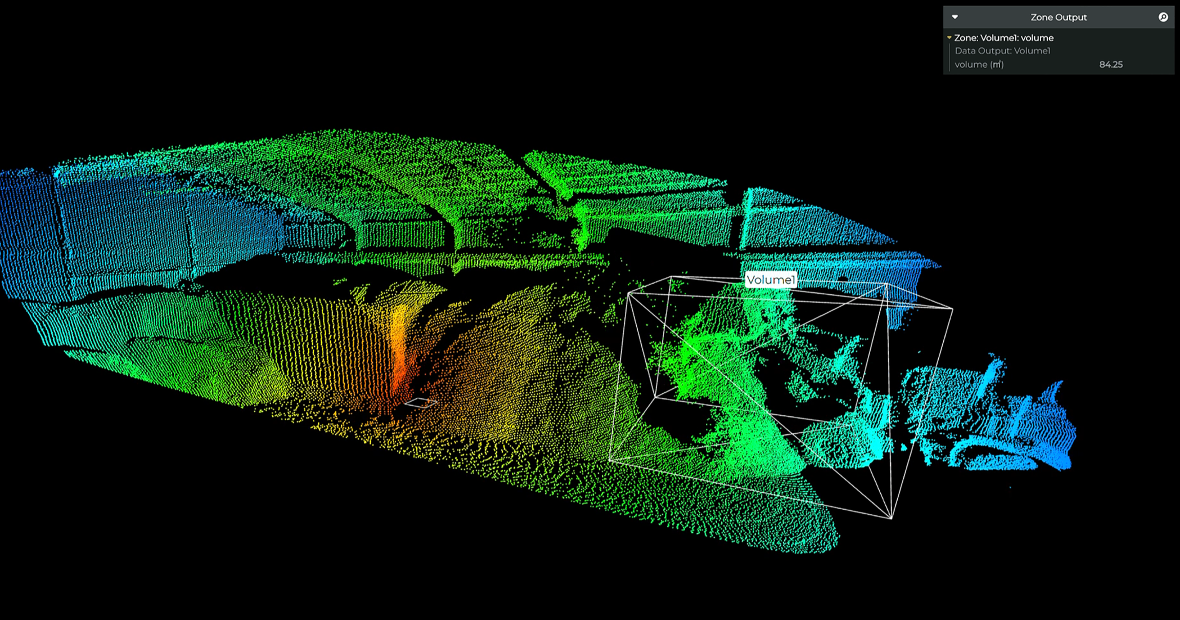
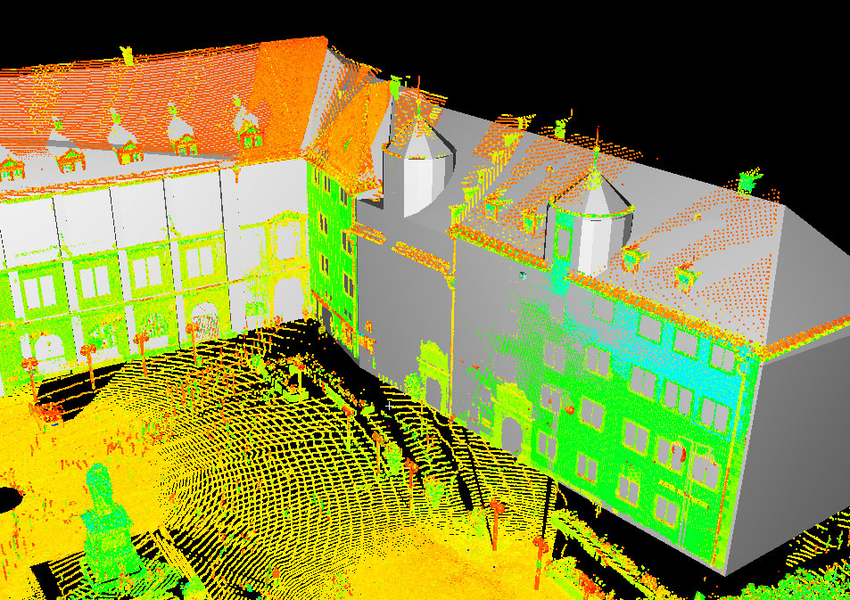
Airborne LiDAR
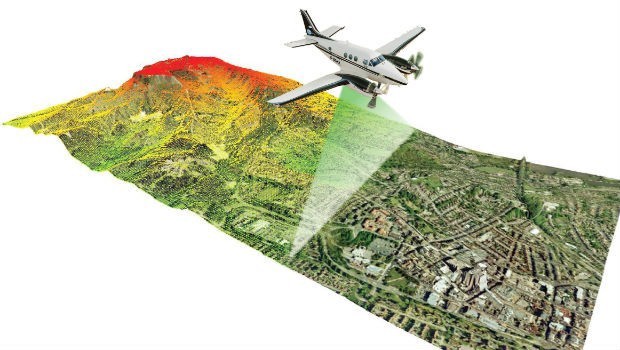
LiDAR (light detection and ranging) is an optical remote-sensing technique that uses laser light to densely sample the surface of the earth, producing highly accurate x,y&z measurements. LiDAR, primarily used in airborne laser mapping applications, is emerging as a cost-effective alternative to traditional surveying techniques such as Photogrammetry. LiDAR produces mass point cloud datasets that can be managed, visualized, analyzed, and shared using ArcGIS.
The major hardware components of a LiDAR system include a collection vehicle (aircraft, helicopter, vehicle, and tripod), laser scanner system, GPS (Global Positioning System), and INS (inertial navigation system). An INS system measures roll, pitch, and heading of the LiDAR system.
Mobile LiDAR
Mobile LiDAR is an innovative mapping solution that incorporates the most advanced LiDAR sensors, cameras and position/navigation to collect survey-quality point data quickly and accurately.
Mobile Lidar (also mobile laser scanning) is when two or more scanners are attached to a moving vehicle to collect data along a path. These scanners are almost always paired with other kinds of equipment, including GNSS receivers and IMUs. One example application is surveying streets, where power lines, exact bridge heights, bordering trees, etc. all need to be taken into account.

Terrestrial LiDAR
Terrestrial applications of lidar (also terrestrial laser scanning) happen on the Earth’s surface and can be both stationary or mobile. Stationary terrestrial scanning is most common as a survey method, for example in conventional topography, monitoring, cultural heritage documentation and forensics.
The technology can provide sub-centimeter level accuracy by capturing data using HDS. Once captured, the laser scanned data points that comprise planar surfaces can be modeled and intersected to create vertices with a much higher level of accuracy and precision than if located by any other available means.
Terrestrial LiDAR can also be used to producing Digital Terrain Models (DTM with a Geo-referenced point cloud dataset. Using this dataset, features can be developed and imported into a Microstation DTM file from which a triangulated irregular network (TIN) is produced with sub-centimeter level accuracy.

